
Hiring? Flexiple helps you build your dream team of developers and designers.
- Home
- Developers
Using Google Lighthouse to audit your web application
Using Google Lighthouse to audit your web application

Ashwin Sathian
Last updated on
Table of Contents
The Basics
Why Google Lighthouse?
The advent and meteoric rise of Javascript-based frameworks & libraries, particularly the front runners Angular and React, means that more number of people/ organizations are gravitating towards web-applications and not plain old websites. In such a scenario, the performance of these applications has taken a front seat as far as priorities go. Recently, I was tasked with making our products as seamless as possible in terms of user experience. Here is where I got started on the lookout for tools that would allow me to analyze the performance of the application and pinpoint the aspects that were dragging down the numbers. This is when I happened to stumble upon Google Lighthouse.

What is Google Lighthouse?
The official page on Google’s developer website describes Google Lighthouse as follows:
Google Lighthouse is an open-source, automated tool for improving the quality of web pages.
Basically, Google Lighthouse is a tool that lets you audit your web application based on a number of parameters including (but not limited to) performance, based on a number of metrics, mobile compatibility, Progressive Web App (PWA) implementations, etc. All you have to do is run it on a page or pass it a URL, sit back for a couple of minutes and get a very elaborate report, not much short of one that a professional auditor would have compiled in about a week.
The best part is that you have to set up almost nothing to get started. Let’s begin by looking at some of the top features and audit criteria used by Lighthouse.
Key Features and Audit Metrics
Google Lighthouse has the option of running the Audit for Desktop as well as mobile version of your page(s). The top metrics that will be measured in the Audit are:
- Performance: This score is an aggregation of how the page fared in aspects such as (but not limited to) loading speed, time taken for loading for basic frame(s), displaying meaningful content to the user, etc. To a layman, this score is indicative of how decently the site performs, with a score of 100 meaning that you figure in the 98th percentile, 50 meaning that you figure in the 75th percentile and so on.
- PWA Score (Mobile): Thanks to the rise of Service Workers, app manifests, etc., a lot of modern web applications are moving towards the PWA paradigm, where the objective is to make the application behave as close as possible to native mobile applications. Scoring points are based on the Baseline PWA checklist laid down by Google which includes Service Worker implementation(s), viewport handling, offline functionality, performance in script-disabled environments, etc.
- Accessibility: As you might have guessed, this metric is a measure of how accessible your website is, across a plethora of accessibility features that can be implemented in your page (such as the ‘aria-’ attributes like aria-required, audio captions, button names, etc.). Unlike the other metrics though, Accessibility metrics score on a pass/fail basis i.e. if all possible elements of the page are not screen-reader friendly (HTML5 introduced features that would make pages easy to interpret for screen readers used by visually challenged people like tag names, tags such as <section>, <article>, etc.), you get a 0 on that score. The aggregate of these scores is your Accessibility metric score.
- Best Practices: As any developer would know, there are a number of practices that have been deemed ‘best’ based on empirical data. This metric is an aggregation of many such points, including but not limited to:Use of HTTPS
Avoiding the use of deprecated code elements like tags, directives, libraries, etc.
Password input with paste-into disabled
Geo-Location and cookie usage alerts on load, etc.
You can find the complete list of scoring criteria for various metrics presented by Google Lighthouse here.
Getting Started
Now that we know what Google Lighthouse can do, let’s see how we can start using it. The first step, of course, would be setting up the tool. The good news here, as I already hinted at, is that Google Lighthouse is already there with you and ready to go if you are using Google Chrome (I strongly suggest you do, if you don’t already). Although there is a popular choice here, I will, for the sake of accuracy, list out all the ways of using Google Lighthouse.
Through Chrome DevTools
If you have used DevTools, you might have come across the ‘Audits’ tab, alongside ‘Console’, ‘Network’, ‘Application’, etc. This Audits functionality is powered by Google Lighthouse.
- Download Google Chrome for Desktop.
- In Google Chrome, go to the URL you want to audit. This could either be a live web application, or your local development server on localhost
- Open Chrome DevTools (Command+Option+J on macOS, Control+Shift+J on Windows)
- Click the Audits tab.
- Click on ‘Run Audits’, sit back and wait for the process to run
Using the Lighthouse NPM package and CLI
If you are a fan of the Command Line, then this is how you can use Google Lighthouse and its CLI. Assuming that you’ve installed Node on your system:
- Download Google Chrome for Desktop<.
- Open Terminal (or Command Prompt on Windows)
- Run the following command
npm install -g lighthouse - Run an audit using the following command
lighthouse <url> - You can see the various audit options by running
lighthouse --help
Thanks to this package, you may run Lighthouse programmatically as well, as part of your application, if you want that.
As a Chrome extension
Unless you have a very specific reason for using the extension, stick to the DevTools workflow as it does exactly the same thing, without having to make any installations
- Download Google Chrome for Desktop.
- Install the Lighthouse Chrome Extension from the Chrome Webstore.
- Go to the page you wish to audit
- Click Lighthouse . It should be next to the Chrome address bar. If not, open Chrome’s main menu and access it at the top of the menu. After clicking, the Lighthouse menu expands.
- Click ‘Generate report’.
Personally, I prefer the DevTools approach since the setup needed is almost nothing to start your audits. The NPM package is preferred when I have had to use Lighthouse programmatically.
Start Auditing!
Audit Options
Let’s now look at the actual Audit process in detail. I will be handling this section assuming you are using Google Lighthouse from the DevTools.
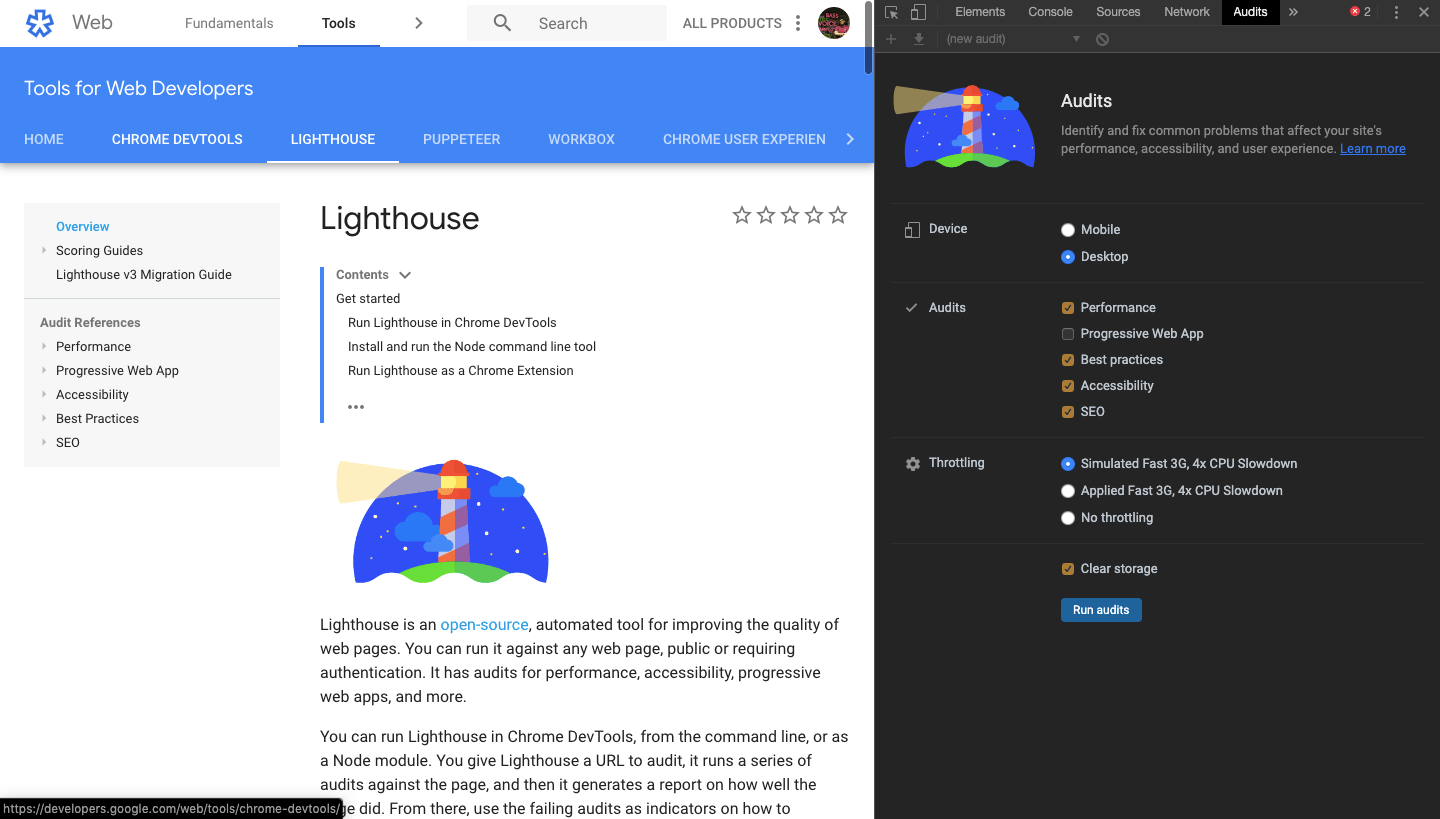
So, what are the options available for us?

As already mentioned, Google Lighthouse allows you to run Audits for Mobile as well as Desktop version of your application – that’s your first level of customization, ‘Device’. Next, we choose which aspects are to be audited. You can choose from the following:
- Performance
- Progressive Web Apps
- Best Practises
- Accessibility
- SEO. Yes, you can get a score for the SEO of your page here. The evaluated parameters include features such as
- Document having a meta description,
- Presence(or absence) of a title element,
- Use of legible font sizes,
- Links not having descriptions
- Presence of unsuccessful HTTP status codes like 400, 404, 500 etc.
What these aspects look at, is something we saw in an earlier section, and SEO score is based on best SEO practises.
The other option that Google Lighthouse provides you with, is Throttling. Basically, this is a chance for you to simulate the performance of the page/ application on a slower internet connection or CPU power of the host machine. Here, you can choose from:
- Simulated Fast 3G, 4x CPU Slowdown
- Applied Fast 3G, 4x CPU Slowdown
- No throttling
Lastly, you have an option to ‘Clear Storage‘, which you can check so that the browser’s storage, distributed across the Local Storage, Indexed DB, etc. are cleared ahead of the Audit. This is particularly helpful when you want as accurate a score as possible for the Performance and PWA metrics.
The same options are available across both Desktop and Mobile device audits.
Conclusion
Pitfalls and Shortcomings
Google Lighthouse is a powerful tool, however, it does come along with some pitfalls. Let’s look at a few here:
- The generated scores are based on widely accepted norms or the data Google Lighthouse has for other applications. So what you see might not be an absolute score or verdict. These aggregates are more a measure of how your page fares up against many others, as well as in terms of the evaluation metrics.
- The network in which you run the audits can have a bearing on the score, especially in the performance aspect – the report for the same page may vary sufficiently across various networks.
- Throttling on the audits options is at best a simulation of what the denoted conditions would be like. Since this is not done at an OS or system level, the results might not be very accurate.
- Usage of browser extensions can pull down the scores. I use a few extensions myself, like one called Dark Reader that I absolutely love, but it reduced performance scores of pages I tested by a fair margin. Hence, it’s recommended that the Audit be run in the Incognito mode of Chrome.
Google Lighthouse, is still a work in progress as an Open Source project and yet, it is one of the most powerful and credible tools we have available at our fingertips to audit our pages. Yes, a lot of enhancements will keep coming in and it will only get better than the current version.
So the next time you wish to ramp up the performance of that slow application/ product, use insights from Google Lighthouse to guide you through the process. I am sure that you will be able to achieve significant results.
P.S: In our next article, we will audit a live website and discuss how to interpret the score and act upon it to improve performance.
Also, we regularly post JavaScript tutorials ranging from advanced to basic concepts. Be sure to check them out.

// Related Blogs

Candidate Sourcing - Definition, Sourcing Process and Ways to Source Talent
How to evaluate a software developer?
What is the best marketplace to hire developers?

How to find & hire the best contract developer for your startup?

How to Evaluate Freelance Developers: Questions to Ask
Inbound vs Outbound Recruitment: A Comprehensive Guide for Successful Talent Acquisition

