
Hiring? Flexiple helps you build your dream team of developers and designers.
- Home
- Developers
Deciphering your Google Lighthouse Audit Report (action points included)
Deciphering your Google Lighthouse Audit Report (along with action points)

Ashwin Sathian
Last updated on
In our earlier blog post on Google Lighthouse, we had discussed what it is, why it’s a developer’s aid and what you can do using it. In this piece, we’ll be looking at a typical Google Lighthouse audit report, try to interpret what the numbers mean, and how we could use the reports to better the score for our application(s)/ page(s).
The specimen page I am auditing for the purpose of this post is www.flexiple.com. Note that while the resolves that we discuss here are particular to the stated URL, many points among these are factors that come up as pain points in most cases.
Let’s dive in then!
Table of Contents
Configuring the audit
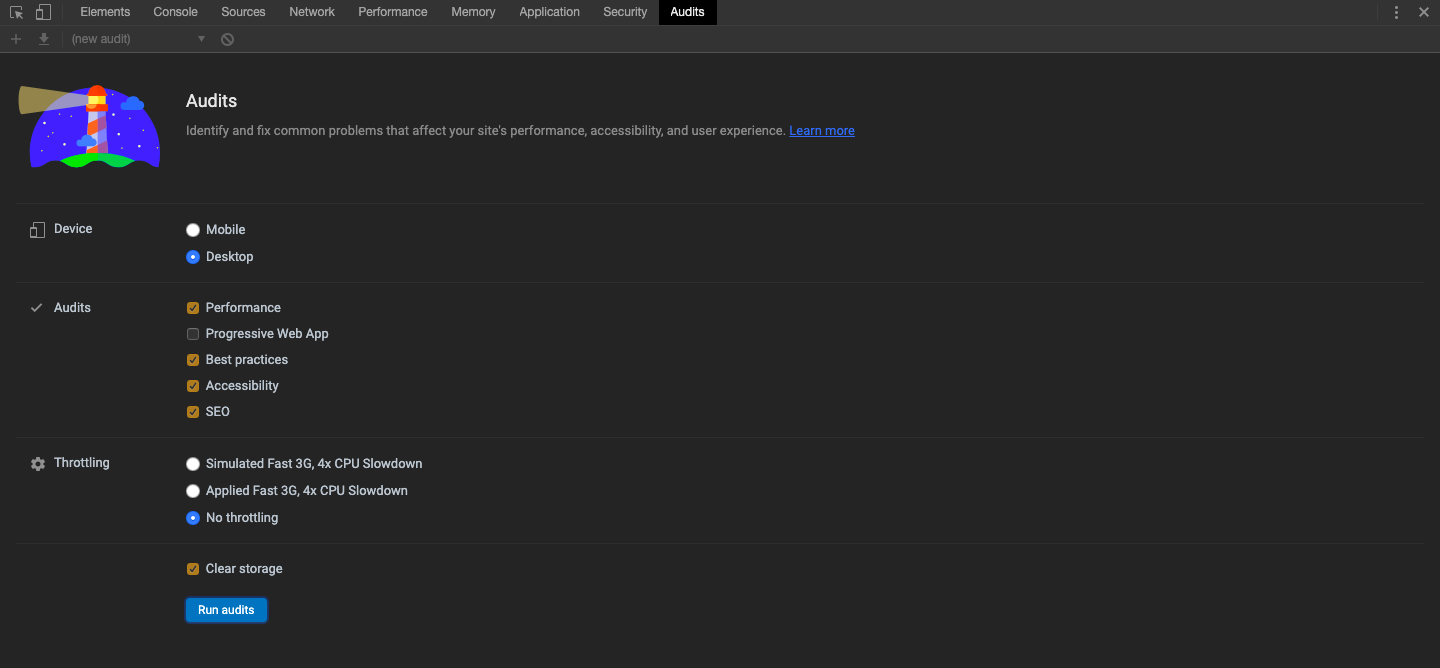
As you can see, I am doing next to nothing out of the ordinary here. All settings or options selected are the default values that are set by Google Lighthouse. The device is ‘Desktop’ and I am running all Audits except ‘Progressive Web App’ because it makes little sense in the Desktop version audit. As an exercise, you are welcome to try selecting this option as well and see what comes up. Spoiler Alert: Nothing will. In a Desktop audit, even if the PWA audit is selected, that section remains blank.
The only option here that I’ve changed from the default value is ‘Throttling’ – rather than simulate for an average 3G network on a poor CPU, I am choosing to run the audits in a non-throttled setup since the amount of people who browse on 3G networks are significantly less and the processors today are quite powerful as well.
Google Lighthouse Report
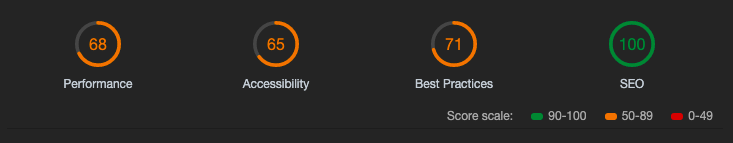
So those numbers that you see on the image, that’s what Google Lighthouse churned for me after running the audit.
At this point, I should remark that over the course of writing this blog, I had run this audit multiple times. There came a point when over the course of about 15 minutes, three iterations of the audit threw up performance scores as low as 38 and a peak of 76 – a case in point for one of the pitfalls mentioned in my first post on Google Lighthouse, where the Performance score in particular is affected greatly by the network on which the audit is being run. But Google Lighthouse is still a work in progress so let’s allow it to pass.
Let’s now look at the numbers in detail and see what went right and what did not.
Performance Score (68/100)
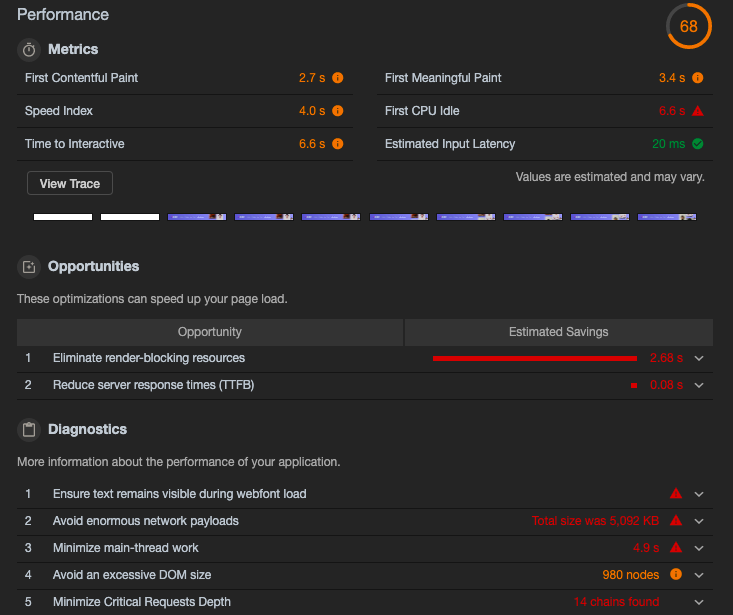
As I already pointed out, this score was affected in some capacity by the network I am on. Yet, the opportunities pointed out here will surely help the page.
For those of you who don’t know what these metrics at the top are,
- First Contentful Paint, or FCP, is a performance metric that measures how much time has elapsed before the browser begins to display the first elements of the site.
- First Meaningful Paint meanwhile, is the time that elapses before something useful and sensible appears – the actual content of the page, beyond say, the header or navigation menu.
- Speed Index is a measure of the time taken for the page load to complete
- First CPU Idle is the time when the application’s main thread execution is complete and is ready for user input
- Time to Interactive is the time after which the page is fully interactive and,
- Estimated Input Latency is the typical amount of time taken by the page to respond to user input during the busiest 5s load window
As you can see, the scores in 5 of the 6 metrics aren’t looking very good. So, what could be done to improve these scores? Frankly, a lot of things. The top suggestions are:
- Minimise render blocking elements, which basically translates to ‘cut down on the number of bells and whistles loaded in the header’. One way this could be done is to cut down the initially loaded CSS to the bare essentials. As far as Javascript goes, popular suggestion is to move the script away form the header but then again, there is only so much you can do about it given the applications are built over Javascript frameworks
- Use better bundling mechanisms for your MEAN or MERN-stack applications and use practices like ‘tree shaking’, which is a bundling process in which unused modules will not be included in the bundle during the build process. (Rollup over Webpack which is Angular's default bundler, perhaps?)
- Exploit neat HTTP caching techniques (such as usage of ETags for validating cached responses, cache-control, etc.) to store resources and/or data in the client’s system, so that page loads improve on further visits. I would recommend exploring this and one place to start would be here.
- Try to be as stingy as possible with the critical resources of the page. This would essentially amount to cutting down on the number of resources or elements you wait for in the initialisation of the page, to the absolute bare-bones.
- Cut down as much as possible on the need for backend/server calls, and for the critical, unavoidable ones, work on the APIs to improve the response times
While addressing these metrics will help improve your score, the points listed under Opportunities and Diagnostics can help improve the User Experience.
One such point is compressing the images used and using image formats such as .webp over the legacy formats like .jpg and .png. Using fancy fonts is neat and goes a long way into improving the look of your application but ensure that you specify fallbacks for the fancy webfonts that you use – as long as things come up real quick, users will be happy to see plain sans-serif text before the likes of ‘Roboto’ or ‘Lato’ loads up. Using web workers/service workers to move some non-critical functions off the main application thread helps too.
To sum up this section, enhancing your application’s performance is an incremental and iterative process. With more methods coming up on the horizon everyday that will help you improve performance at least in an ever-so-small amount, you can eventually get there, sooner than later.
Accessibility Score (65/100)

Here’s the deal – in an ideal world, you can absolutely ignore this metric. But like we learnt back in school, ‘ideal’ is just a theoretical concept (remember ideal gases?). Guardians of the internet and the world wide web have in the past few years realised that Internet is meant not just for a select group of people, but for all – the differently abled too. That is why HTML for one, introduced features that greatly favour accessibility options that favour tools like screen readers. And when they have done their part, it’s up to us, developers, to ensure that our product is universally accessible and that is where this score comes into the picture.
The good thing about this metric is that the place where most applications lose points, are for a similar set of reasons – reasons that you can completely address, fix and ensure even a perfect 100 score.
- Use of Accessible Rich Internet Applications (aria-) and ‘role’ attributes: A feature supported by most of the popular browsers and OS-es today, these set of attributes, used primarily as part of the HTML(5) code, helps systems interpret your pages better for accessibility options like Screen Readers.
<div id=”percent-loaded” role=”progressbar” aria-valuenow=”75″ aria-valuemin=”0″ aria-valuemax=”100″></div>
In this example, a progress bar is built using a <div>, which has no meaning. Unfortunately, there isn’t a more semantic tag available to developers in HTML 4(HTML5 introduced the <progress> element.), so we need to include ARIA roles and properties. These are specified by adding attributes to the element. In this example, the role=”progressbar” attribute informs the browser that this element is actually a JavaScript-powered progress bar widget. The aria-valuemin and aria-valuemax attributes specify the minimum and maximum values for the progress bar, and the aria-valuenow describes the current state of it and therefore must be kept updated with JavaScript.
Courtesy: MDN Docs
- Use of contrasting background and foreground colours – Believe me, I have seen UI elements in application with white white text on light pale yellow! True, most people can make this out but more people than you can imagine, find that combination a hard one. End of the day, even from a product point of view, text in particular should have contrasting background and foreground colours so that the text strikes and sticks to the user, even on a cursory glance.
The optimum contrast value is dependent on features including but not limited to font-weight, font-size, etc. According to the WCAG2 (Web Content Accessibility Guidelines), a minimum contrast ratio of 4.5:1 for text under 18px, and a contrast ratio 3:1 for text larger than 18px, is good to follow as a rule of thumb - To round off the list, usage of ‘alt’ attribute on images and similar descriptors on tags which allow for them to be discerned better by accessibility tools.
Best Practices Score (71/100)
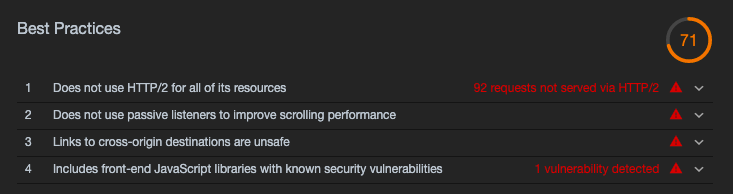
Every developer out there will agree with me on this – you might know 100 ways to implement a feature or functionality but chances are high that you’ll sooner than later come across a new way of doing it. In such a scenario, there are a set of commonly accepted set of practices that are deemed as the ‘best’. This metric is a measure of how well you have adhered to these best practices.
Some top points that come up in this audit are:
- Not using HTTPS to make calls to external resources – While things will be perfectly fine 9 times out of 10, HTTP calls aren’t the best way when we take security into account, mainly because of the reason that HTTP fetches data/ resources in an unencrypted manner. Also, some of the modern browsers raise warnings or block loads altogether when HTTP calls are made to resources. Hence, the best practice would be to try to make all such calls HTTPS.
- Unsafe cross-origin destinations – Many a time, we have to make calls to domains that are not our own, for resources. Handling of these resources in a safe and secure manner is a matter of prime importance. The best practise suggested for this is use of attributes like rel=”noopener” or rel=”noreferrer”.
- Usage of deprecated APIs/methods – While they may serve the intended purpose, deprecated methods are a precursor for their removal in further versions of the language/library. It’s always a best practise to revise your codebase to remove these deprecations.
- Yet another best practise would be to alert users in case you intend to send notifications and use cookies/geolocation.
Best practices, like the technologies we use, will keep changing and updating over time. While a practise may be deemed best today, it could in the future turn out to be a security flaw among other things. Hence, running this audit regularly, as well as staying on top of the new updates is always a good idea.
SEO score (100/100)
Flexiple got the full monty here with a perfect 100 score. But for those of us who still haven’t gotten there, I will use this section to throw in some pointers on how you can get there.
- Use of document meta tags – Meta tags are one of the most underrated elements in any HTML document. Right from the point where they define the character set used in a document through to the definition of the viewport, they do a lot. A definite thing they can do is giving some credential to your pages – meta tags can be used for adding custom data such as document title, description, author’s name etc. The meta tags’ data is consumed by crawlers and engines to index your page(s)
- ‘robot.txt’. This file is basically the instructions we pass to a web crawler indicating what parts of our application are public and hence crawlable. While the absence of this file hides your application from search engines, a misconfigured robot.txt is equally bad.
It is worth noting here that Lighthouse’s SEO audit barely scratches the surface as far as SEO audits go. Yes, they do give you a vague idea of where you stand but a good score here should not be taken for granted and certification enough that your SEO is great. That being said, a poor SEO socre here would mean that you really need to put in serious effort in optimising your application for the Googles and Bings.
Conclusion
One might argue that Google Lighthouse audit reports aren’t by any means the gold standard as far as page audits go. I agree with you but the fact remains that as far as such tools go, not a lot can beat Google Lighthouse in automated page audits and report generation. As an open source project, Google Lighthouse is constantly being updated by the best in the business to make it more potent by the day. As a tool that’s available at your disposal, we can safely say that Google Lighthouse is here to stay and goes to great lengths in helping us improve our pages/applications.


